Stippling of 2D Scalar Fields
by Lukas Herzberger and Jakob Troidl

Description
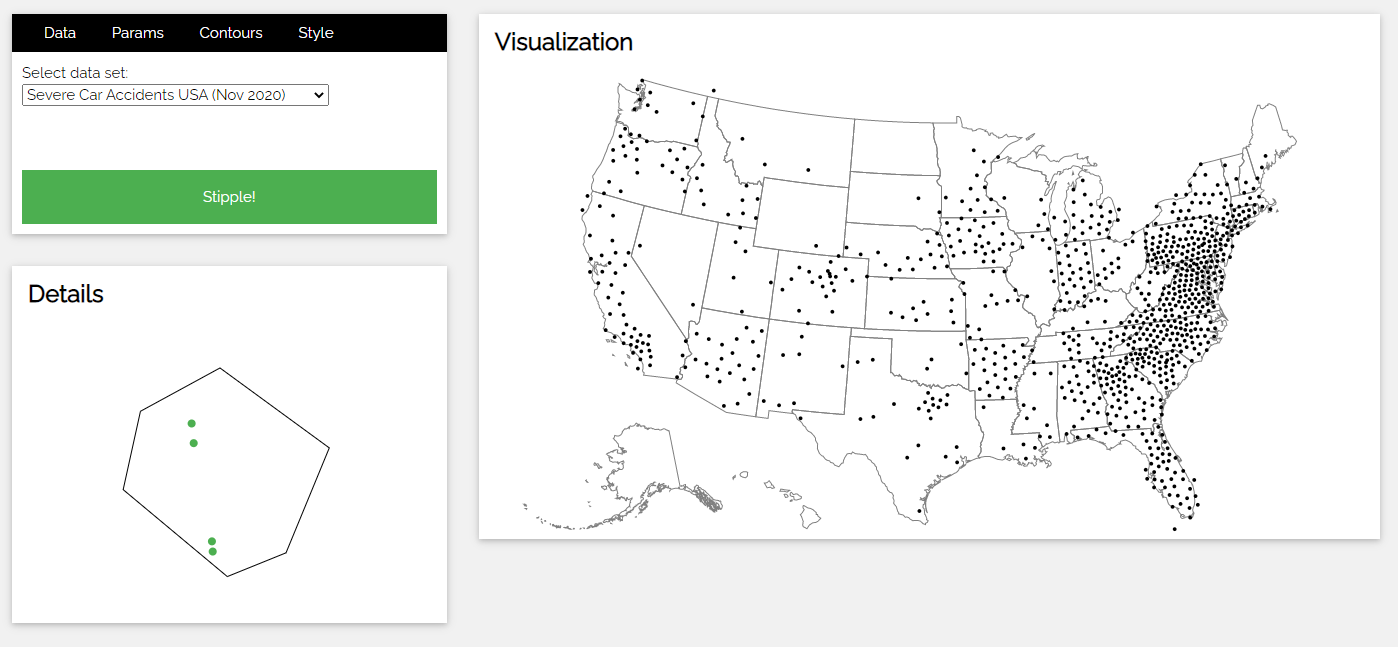
Our interactive web application is designed to stipple a wide range of the 2D scalar fields and is publicly accessible here. We support two data formats. First, .csv or .json files are supported to stipple discrete data sets such as data with spatial context. For example, the image below shows a stippled representation of severe car accidents in the United States during November 2020. We also provide a detailed view for these data sets by showing the respective Voronoi region and the data points when hovering over a stipple. For such data sets, x and y (or lon/lat) attributes must be specified to render the data points correctly.
The web application lets user tuned stippling parameters via the top left input panel. This panel allows setting the data set, adjusting the stipple size, the color map and enabling/disabling contours (mach banding).
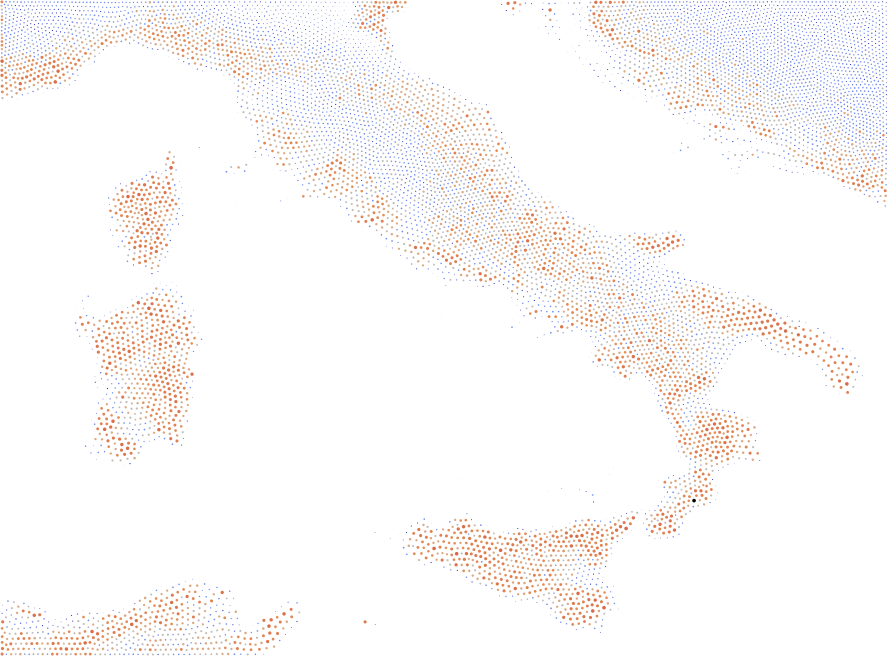
Second, we stipple continuous data sets by supporting images as an input. We first convert the images to greyscale images and then use them as a density function with values on a regular grid. The visualization below illustrates this approach by showing a stippled version of Italy's height map.
Contours
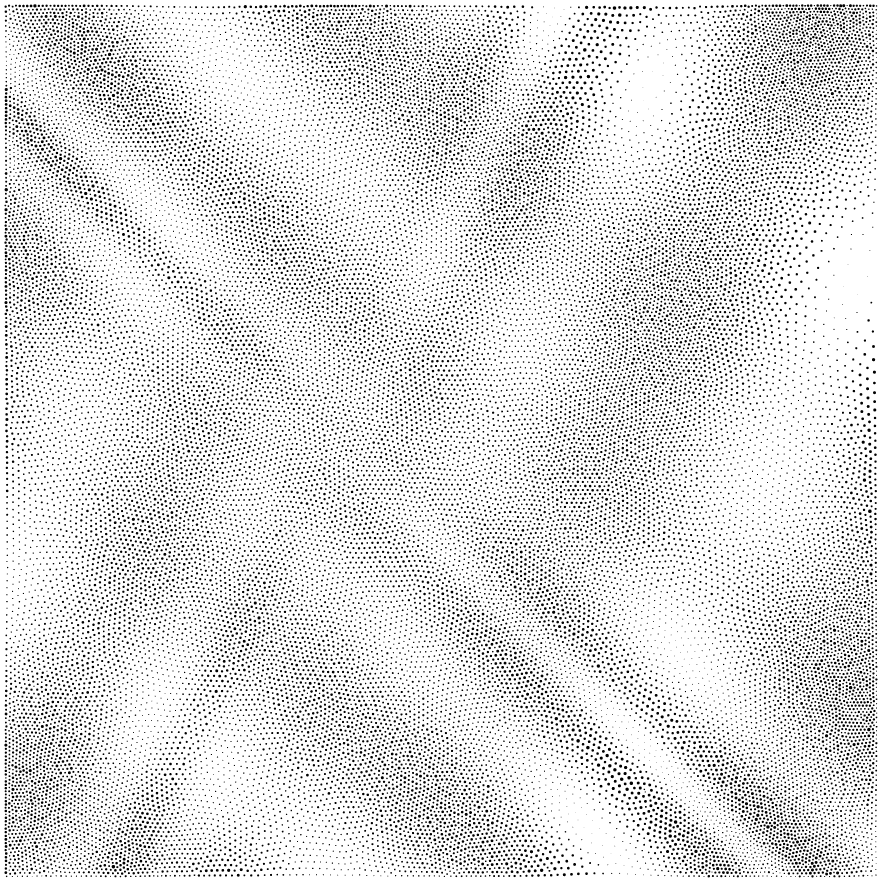
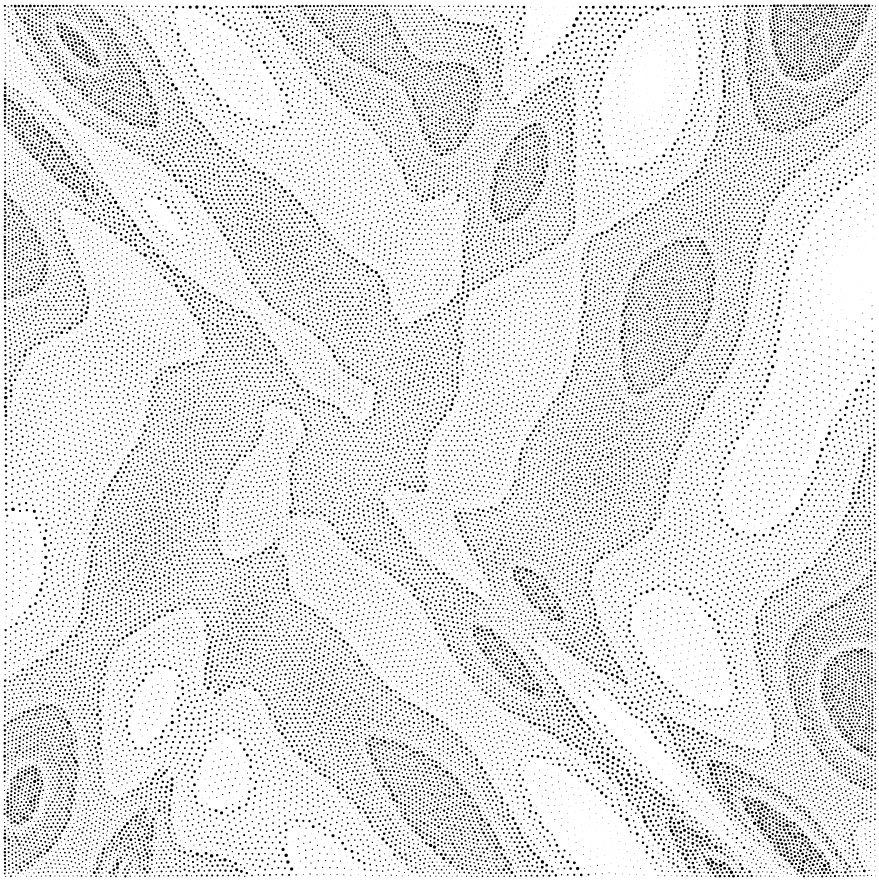
To highlight the contours of 2D scalar fields, we have implemented mach banding as described in the paper. Below we show a comparison between a stippled visualization of the eggholder function without mach banding and with mach banding. The contours are clearly visible.
Implementation
We implemented the application using Node.js, D3.js and JavaScript. We have deployed our application with Heroku. The documentation was generated by JsDoc. Data cleaning and processing was in part done in Python.
References
Görtler, J., Spicker, M., Schulz, C., Weiskopf, D. and Deussen, O., 2019. Stippling of 2D scalar fields. IEEE transactions on visualization and computer graphics, 25(6), pp.2193-2204. Download
Datasets: US accidents, hail storms, topological data, Meister, CG-Logo